Extracellular vesicles are the core of Cellarcus’ work. Our labs are equipped with specialized instrumentation and dedicated personnel for EV research. Our expertise is here for your pivotal studies.

Sample requirements and recommendations
General requirements
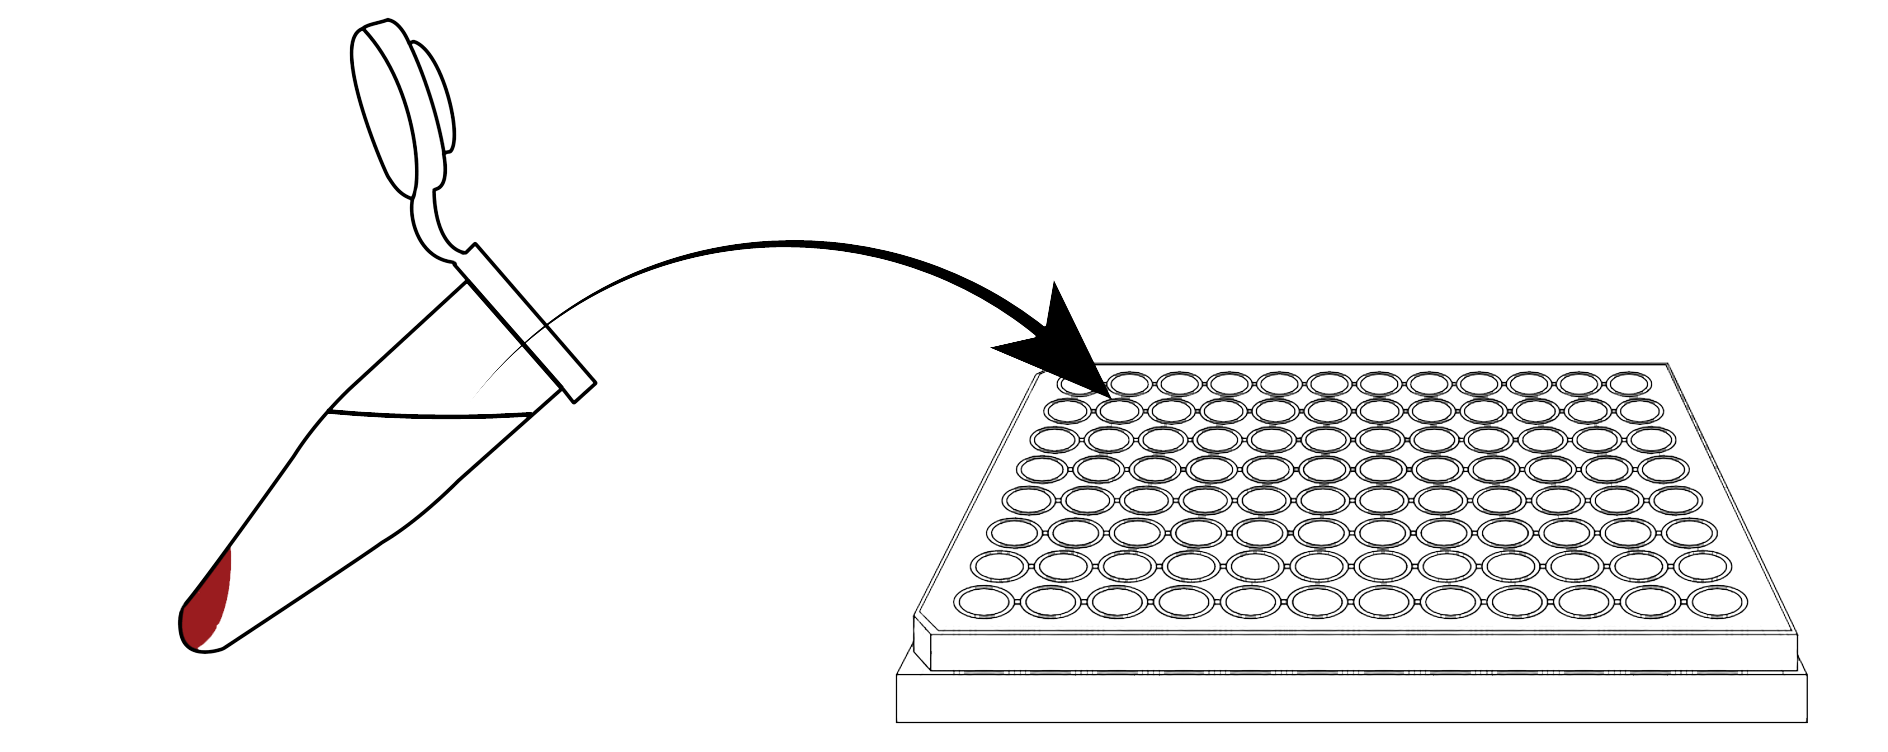
vFC™ analysis generally requires ~100 ul of sample at an EV concentration of 1×10⁷ EVs/uL. This will allow determination of EV concentration and optimal dilution and vFC™ surface cargo measurement. Once conditions are optimized, individual measurements require sample volumes of 5 uL or less.
Specific recommendations
Enriched EVs: vFC™ analysis is compatible with any of the popular EV enrichment methods, including ultracentrifugation (UC), density gradient ultracentrifugation (DGUC), polymer precipitation (PPT), or ultrafiltration (UF)/tangential flow filtration (TFF). A minimum volume of 100 uL at an EV concentration of 1 x 10⁷ vesicles/uL or greater. If the EV concentration is not known, a dilution series will define concentration, limit of detection, and dynamic range of the vFC™ assay.
Culture media: EVs can be detected directly in serum-free culture supernatants, though EV concentrations are often too low. In general, it is recommended to concentrate culture supernatants 50-100x using centrifugal ultrafiltration (eg Amicon 100K MWCO centrifugal filter) or one of the other enrichment methods.
Plasma: Spin citrated blood at 2500 x g for 10 minutes to remove cells and large debris. Aspirate the supernatant and transfer to a new tube and repeat the spin. Aliquot the cell-free supernatant and freeze at -80°C. Plasma EV concentrations are in the range of 108-109 vesicles/uL, so aliquots of 25 uL generally suffice for measurement of abundant EVs. For measurement of less abundant EVs, size exclusion chromatogoraphy (SEC) can be an effective step to enrich EVs relative to soluble proteins and smaller lipoprotein particles (LPPs).
Cerebrospinal fluid: Spin CSF at 2500 x g for 10 minutes for cell and debris removal. Next, transfer the supernatant to a new tube and repeat. Aliquot the cell-free supernatant and freeze at -80°C. CSF EV concentrations are in the range of 105-106 vesicles/uL, so aliquots of at least 100 uL are required.
Other biofluids: Recommendations under development.
Data Produced by VFC Analysis
Vesicle concentration: in units of vesicles/uL
Vesicle population size distribution: estimated using well-characterized synthetic vesicles as reference particles
Vesicle surface protein frequency: percent positive above threshold level of detection
Vesicle surface protein abundance: in units of mean equivalent soluble fluorochromes (MESF) or estimated antibodies bound per vesicle (ABV)

Let’s work together
Need to send us sample info? Fill out this form. Get to the data that will describe the role of extracellular vesicles in your research aims. Fast forward to your discoveries.

